How to Fix Low Website Conversion Rate is an obvious problem, it is usually the result of small friction points stacking up across your funnel, from a slow loading landing page to a confusing checkout form. Fixing it starts with diagnosing where visitors are dropping off, not with guessing at redesigns or copy tweaks that sound good in theory.
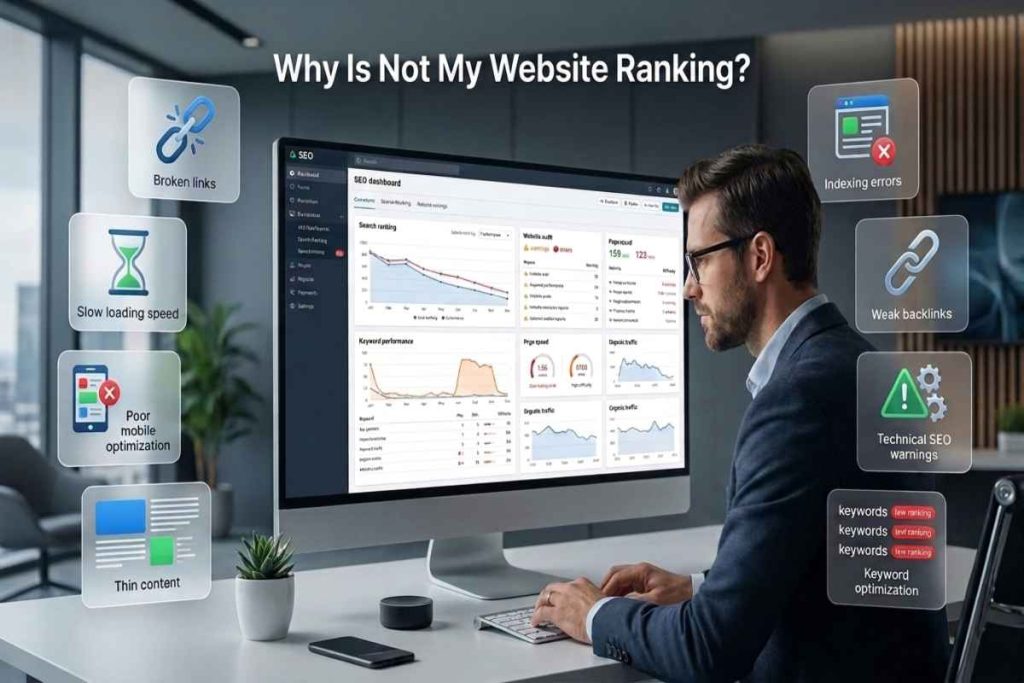
Most site owners jump straight to fixes ,new headlines, new colors, new CTAs ,before they have confirmed what is actually broken. That is backwards. A conversion rate is a symptom, not a diagnosis. If your traffic is healthy but visitors are not converting, the cause could be mismatched intent, a slow page, unclear value proposition, a broken mobile experience or simply too much friction between interested and done. Treating all of these the same way wastes time and rarely moves the number.
This playbook walks through the exact process we use to fix a low conversion rate, how to tell if your rate is actually low compared to industry benchmarks, how we diagnose the real cause using funnel data rather than assumptions and the specific workflow we run to fix it ,illustrated with a real study from start to finish. By the end, you will have both the framework and a concrete example of how it plays out in practice.
What Counts as a Low Conversion Rate? Benchmarks by Industry
There is no universal number that defines a low conversion rate ,it shifts based on your industry, where your traffic comes from and what you are counting as a win. As a rough starting point, most sites converting well under 2–3% have real room to improve. But before touching any fix, you need to confirm whether your rate is genuinely underperforming or whether you are simply measuring it against the wrong yardstick.
What Is a Good Conversion Rate in 2026?
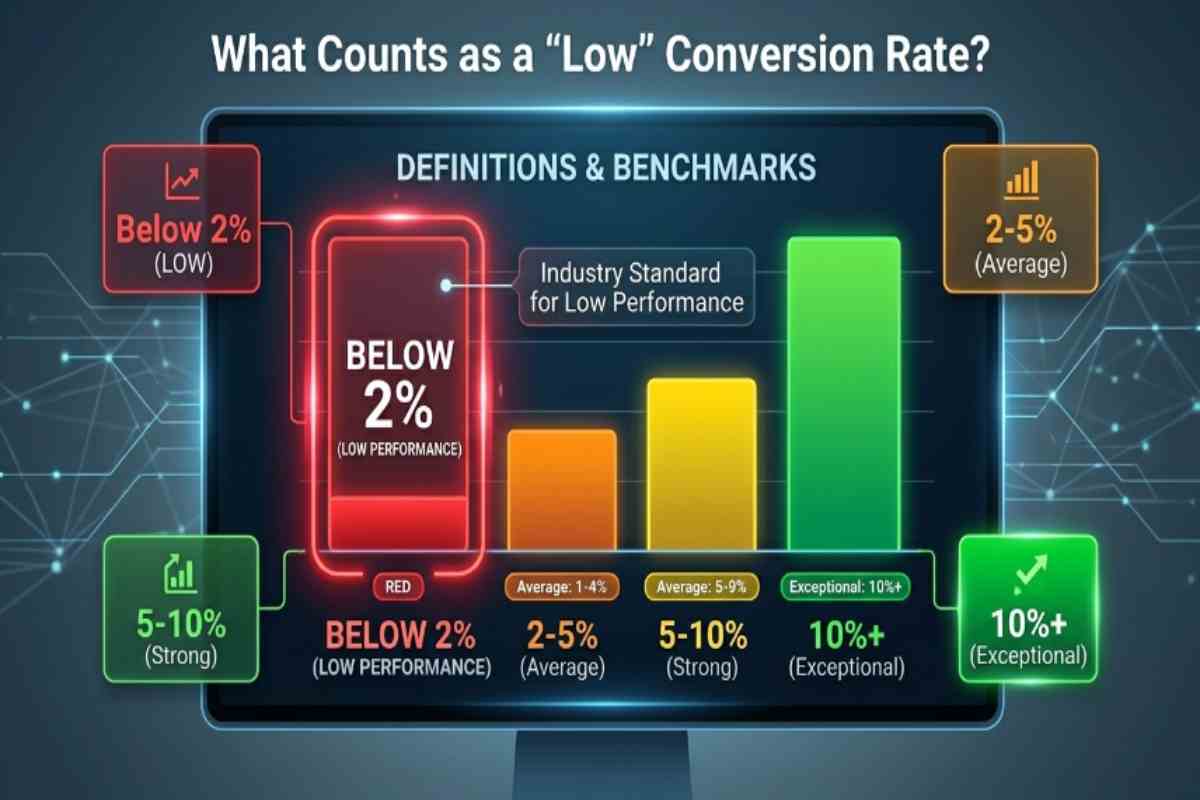
Across most industries, a solid conversion rate in 2026 sits somewhere between 2% and 5%. Cross that threshold and you are doing well, break past 10% and you are in rare territory. The average site converts a little over 2% of its visitors. Yet, the strongest performers pull in roughly five times that figure ,not through luck, but through repeatedly stripping friction out of the user journey.
Where people go wrong is judging their own number against one flat, cross industry average instead of a benchmark suited to their specific traffic and offer. A 3% rate could be outstanding for a law firm consultation request form and disappointing for a basic email opt in, so use general figures as a reference point rather than a finish line.
Average Conversion Rate by Industry Ecommerce SaaS, Lead Gen and Landing Pages
Because business models differ so much, industry specific ranges matter far more than any blended average. Ecommerce sites typically land between about 1.8% and 3%, though that swings hard by category ,food and beverage brands often reach 4.5–6%, while luxury goods and jewelry hover closer to 1% or below. SaaS and B2B companies see a different pattern, median site wide conversion sits near 2.9%, a 3–5% free trial to paid rate is considered healthy and 8–12% is exceptional.
Lead generation pages perform even stronger, often converting near 11.9% on average, while dedicated landing pages built around one clear action tend to average around 6.6% across industries. If your figures sit well under the range for your category, that is your cue to move into diagnosis ,and if the gap is not obvious, a structured Web Solutions audit can usually surface the cause faster than trial and error.
How to Calculate Your Website Conversion Rate
The formula itself is simple, take your total conversions, divide by unique visitors and multiply by 100. Two thousand visitors and 50 conversions gives you a 2.5% rate. Where people trip up is not the math ,it is how they define “conversion” in the first place.
Combining purchases, form submissions, phone clicks and email signups into one blended number buries the real story of where your funnel is breaking down. Measure each conversion type on its own and double check that your analytics tracking is set up correctly before drawing conclusions ,a rate that looks low is sometimes a tracking gap, not an actual performance issue.
The Real Problem What Was Actually Going Wrong
The client behind this example was generating consistent traffic but converting only a fraction of visitors into leads, a pattern that is common, frustrating, and almost always traceable to a specific, fixable cause once you know where to look. This section walks through exactly what we found before any fix was applied, so the diagnostic process later in this guide has real context behind it.
The Client Situation Before the Fix
The client, a mid sized service business, had invested heavily in paid and organic traffic over the previous year and was seeing steady month over month growth in visitors. On paper, the marketing was working. But that growth was not translating into revenue, leads and inquiries stayed flat even as sessions climbed, which meant every new visitor was effectively costing more to acquire while contributing less.
The site itself had been built several years earlier and had never gone through a structured Website Design and Development review, so nobody had a clear picture of whether the site itself was the bottleneck or whether the problem lived elsewhere in the funnel.
What the Traffic and Analytics Data Showed
Pulling the analytics told a more specific story than low conversions. Visitors were reaching the site in strong numbers and engaging with content ,time on page and scroll depth were both healthy ,but drop off spiked sharply at two points, the transition from the homepage to the primary service pages and again at the contact form itself.
Mobile sessions, which made up over half of total traffic, converted at less than half the rate of desktop. That gap alone pointed to a device specific issue rather than a broad messaging or offer problem, which narrowed the diagnosis considerably before any redesign work began.
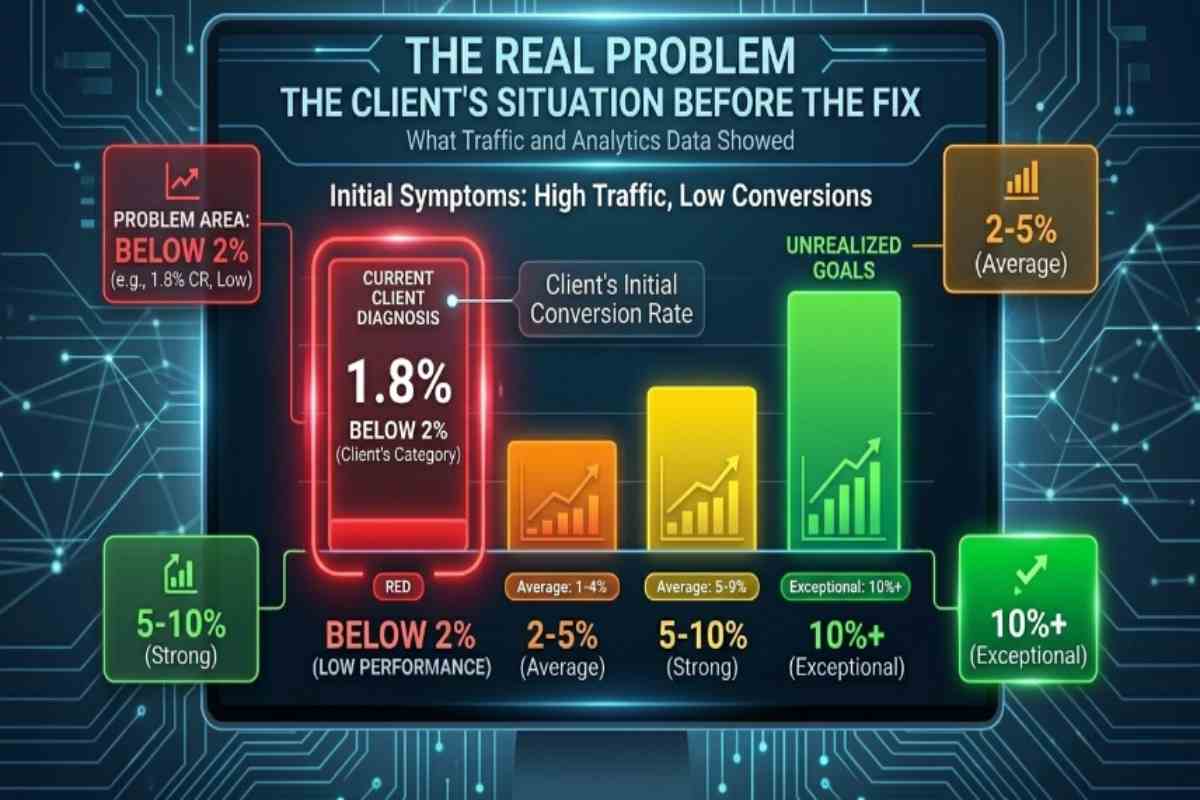
Initial Symptoms ,High Traffic and Low Conversions
The surface level symptom was simple, plenty of visitors, very few conversions. That combination is one of the clearest signals in web analytics because it rules out a demand problem ,people were interested enough to click through and land on the site ,and points instead toward friction somewhere in the experience itself.
Slow loading service pages, a contact form that asked for more information than necessary and a mobile layout that had not been tested on newer devices all emerged as early suspects. None of them were confirmed yet at this stage ,that came next, in the diagnostic process ,but the pattern was consistent with a funnel losing visitors to friction rather than a traffic quality or targeting issue.
Our Diagnostic Process, How We Found the Real Cause
We diagnosed the client low conversion rate by tracing the funnel step by step rather than guessing at fixes, which is the only reliable way to separate real friction points from cosmetic issues that do not actually move the number. The goal was not to find something to change ,it was to find the specific point where interested visitors stopped becoming leads.
Auditing the Funnel Step by Step
We started at the entry point and moved forward one stage at a time, landing page, service page, contact form, confirmation. At each stage, we checked load time, mobile rendering and whether the page delivered on what the traffic source promised ,a paid ad, an organic search result or a referral link.
This step by step approach mattered because it isolated the funnel into segments we could test independently instead of treating the whole site as one black box. The homepage to service page transition revealed the first real leak, nearly a third of visitors who reached the homepage never made it to a service page, despite strong initial engagement metrics.
Common Hidden Causes of Low Conversion Rates
Once we isolated where visitors dropped off, we checked it against the causes that most often hide behind a low conversion rate, slow page load on mobile devices, contact forms that ask for too much information too early, unclear or buried calls to action, a mismatch between what the traffic source promised and what the landing page delivered and trust signals ,reviews, credentials, past results ,that existed on the site but were not visible where decisions were actually being made.
In this case, three of those five were present at once, a mobile load time nearly twice that of the desktop equivalent, a contact form with 11 required fields and trust signals buried on a separate “About” page rather than appearing near the form itself.
Tools and Metrics We Used to Isolate the Problem
We relied on a combination of quantitative and behavioral data rather than relying solely on analytics numbers, since traffic and conversion counts tell you something is wrong but rarely why. Google Analytics 4 provided the funnel drop off data and device level segmentation that first flagged the mobile gap.
Session recordings and heatmaps showed how visitors actually interacted with the contact form ,including where they hesitated or abandoned it mid fill. Core Web Vitals data confirmed the mobile speed issue with hard numbers rather than assumptions. Together, this combination turned a vague symptom ,low conversion rate ,into three specific, testable hypotheses, which is what made the fix in the next section targeted instead of a guess.
The Fix, Our Exact Workflow to Improve Conversion Rate
Once the diagnosis pointed to three specific issues ,mobile load speed, a bloated contact form and misplaced trust signals ,the fix became a matter of execution rather than experimentation. Here is the exact workflow we ran, in the order we ran it, to move the client conversion rate from a symptom to a solved problem.
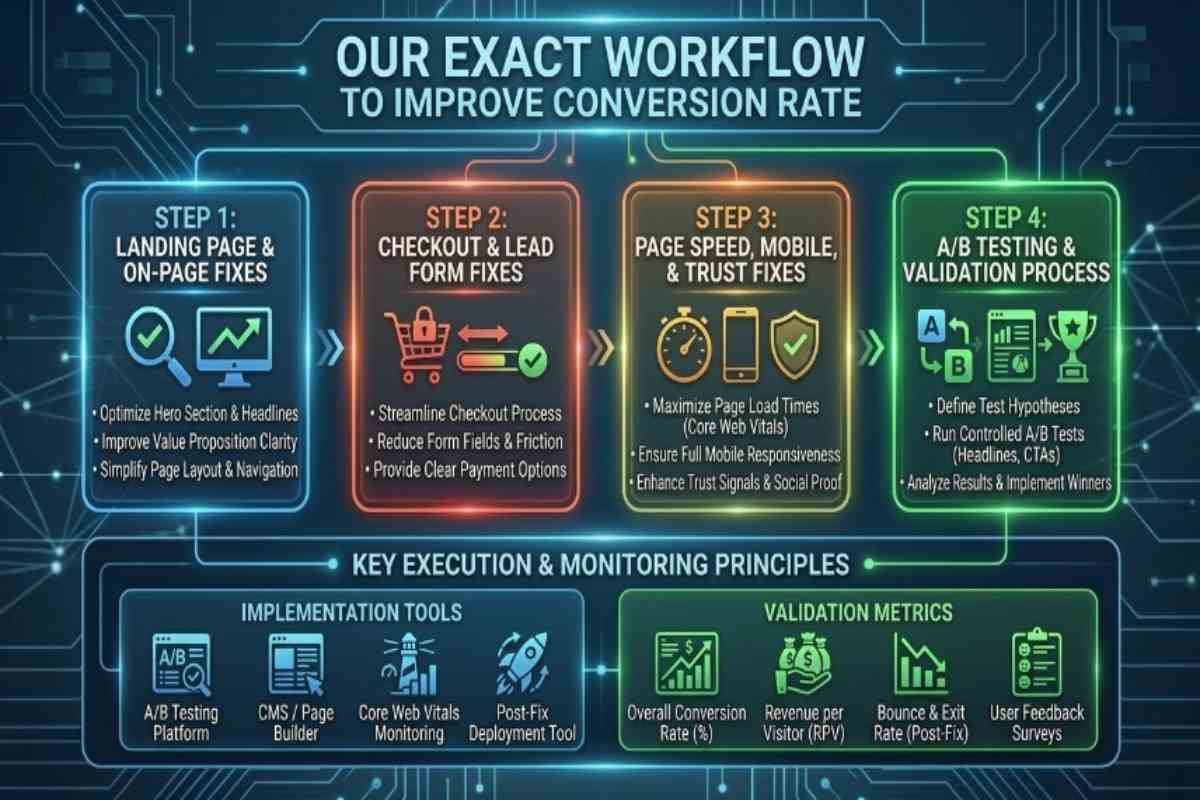
Landing Page and On Page Fixes
We started with the page that was losing the most visitors, the homepage to service page transition. Rather than a full redesign, we tightened the messaging hierarchy so the primary call to action appeared above the fold and matched the language used in the paid and organic campaigns driving traffic to each page ,closing the expectation gap that was causing early drop off. This included a full On Page SEO pass across the service pages, cleaning up header structure, internal linking and content clarity so each page reinforced intent instead of diluting it with unrelated information. The result was a more direct path from click to next step, with fewer distractions competing for attention.
Checkout / Lead Form Fixes
The contact form was cut from eleven required fields down to four, name, email, phone and a single dropdown describing the inquiry type. Everything else ,budget, timeline, referral source ,moved to a follow up email sequence instead of gating the initial submission.
We also added inline validation so errors surfaced immediately rather than after a failed submit, which session recordings had shown was a recurring point of abandonment. This single change ,reducing form friction at the exact moment of commitment ,is consistently one of the highest leverage fixes available, because it removes the last barrier between an interested visitor and a completed conversion.
Page Speed, Mobile and Trust Signal Fixes
Mobile load time was the most technically involved fix and also the most impactful. We ran a dedicated Website Speed Optimization Services engagement to compress images, defer non critical scripts and reduce server response time, cutting mobile load time by more than half. Because the site ran on WordPress, a large share of that improvement came from WordPress Performance Optimization work ,plugin audits, caching configuration and database cleanup that had never been done since the site launched. Alongside the speed work, we moved trust signals ,client logos, review scores and case results ,out of the buried About page and placed them directly above the contact form, so visitors saw proof of credibility at the exact moment they were deciding whether to convert.
A/B Testing and Validation Process
None of these changes went live sitewide all at once. We ran the form redesign and trust signal placement as an A/B test against the original pages for three weeks, splitting traffic evenly and tracking conversion rate, form completion time and mobile specific performance separately from desktop.
This validated that the lift was coming from the changes themselves and not from unrelated traffic fluctuations. Once the test confirmed a statistically significant improvement, we rolled the winning variant out sitewide and moved on to the next set of pages, applying the same audit fix test cycle rather than treating the redesign as a one time project.
Channel Specific Playbooks
The core fix workflow ,diagnose, remove friction, validate, roll out ,applies across every business model, but the specific levers that move the needle differ by channel. Here’s how that playbook adapts depending on whether you are running an online store, a SaaS product, a paid landing page or a lead generation funnel.
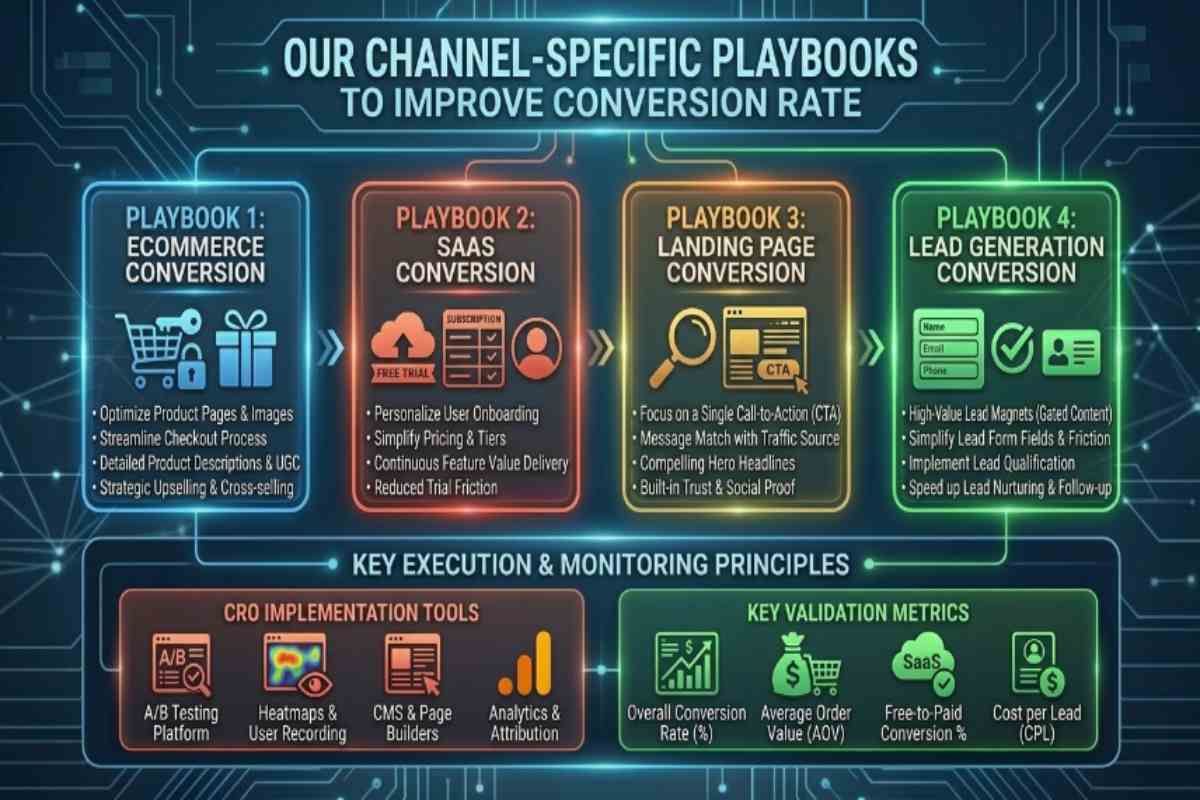
How to Improve Ecommerce Conversion Rate
Ecommerce conversion rates hinge on three things above all else, product page trust, checkout friction and mobile speed. Product pages need clear pricing, real customer reviews and answers to pre purchase objections ,shipping cost, return policy, sizing and visibility without requiring a click to find them.
Checkout is where most ecommerce revenue quietly leaks, every extra field, forced account creation or unclear shipping cost disclosed late in the process gives a hesitant buyer a reason to abandon the cart. Guest checkout and one tap payment options consistently close that gap. Because ecommerce traffic is often SEO dependent for organic growth, pairing conversion fixes with dedicated Ecommerce SEO work ensures the traffic reaching those improved pages is already qualified to buy, rather than browsing without intent.
How to Improve SaaS Conversion Rate
SaaS conversion depends less on a single purchase decision and more on reducing the perceived risk of committing to a trial or demo. The biggest lever is aligning the pricing page and trial signup flow with the specific use case a visitor arrived to solve ,generic feature lists convert worse than pages that speak directly to a job to be done.
Removing credit card requirements from free trials, shortening onboarding to a single clear first action and placing customer logos or research results near the signup form all reduce the hesitation that causes high intent visitors to leave without converting. Because SaaS buyers often return multiple times before committing, retargeting and email nurture sequences matter as much as the page itself.
How to Improve Landing Page Conversion Rate
Landing pages convert best when they do one thing, supporting a single call to action with zero competing distractions. That means removing site navigation, cutting the page down to only the content that supports the offer and making sure the headline mirrors the exact language used in the ad or search result that brought the visitor there.
Mismatched messaging between the traffic source and the landing page is the single most common reason a well designed page still underperforms ,visitors expect continuity and any gap creates hesitation. Load speed matters disproportionately here too, since landing pages are frequently the destination for paid traffic, where every second of delay directly increases cost per acquisition.
How to Improve Lead Generation Conversion Rate
Lead generation conversion rate is almost always a function of form friction and response speed. Shorter forms consistently outperform longer ones, but the bigger lever many businesses overlook is what happens after submission ,leads contacted within minutes convert to actual clients at dramatically higher rates than those followed up with hours or days later.
Multi step forms, where a visitor answers one simple question before being asked for contact details, often outperform single long forms because they create commitment before the harder ask. Pairing a shortened form with clear trust signals ,testimonials, credentials or guarantees positioned near the submit button ,addresses the hesitation that causes visitors to abandon mid form.
Results Before vs After
After rolling out the form redesign, speed fixes and trust signal placement, the client’s overall improve conversion rate more than doubled within eight weeks ,moving from a stagnant baseline into territory well above their industry average. The improvement wasn’t a single dramatic jump it built in stages as each fix was validated and rolled out, which is exactly the pattern you should expect from a properly sequenced conversion rate fix rather than a one time redesign.
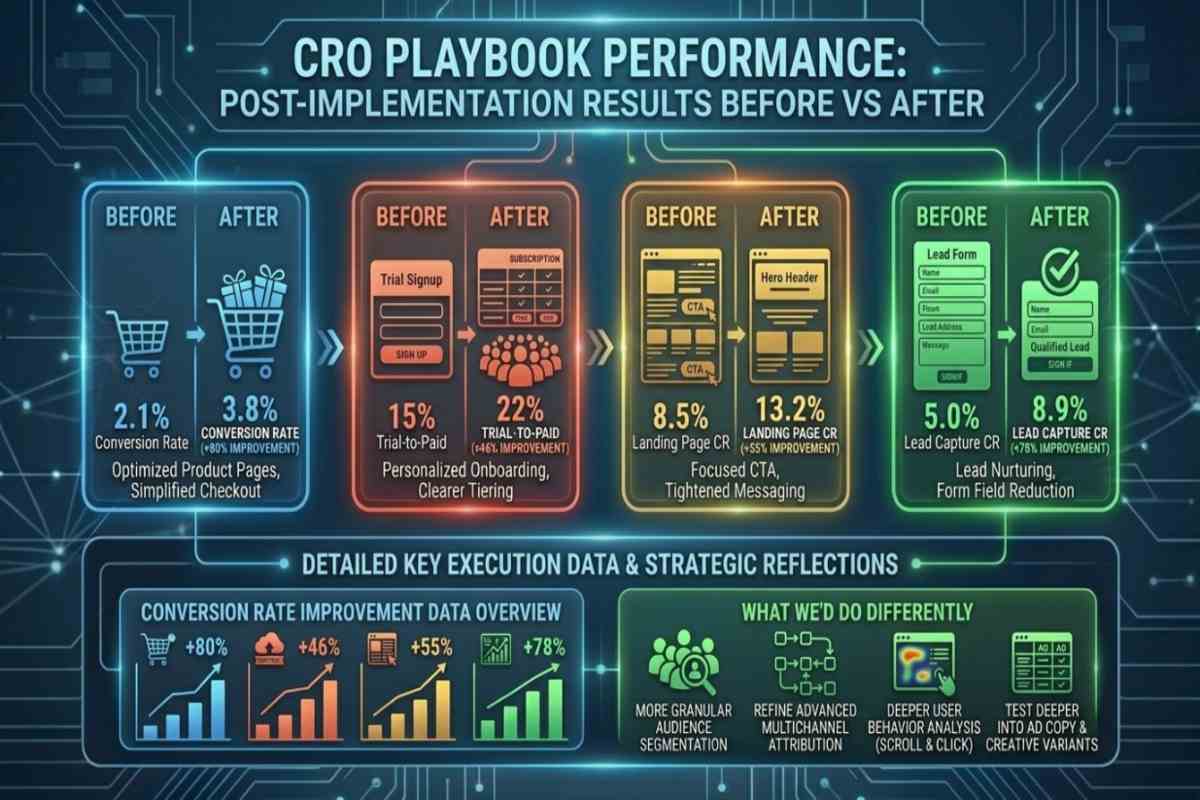
Conversion Rate Improvement Data
The site overall conversion rate rose from roughly 1.4% to 3.1% over the eight week rollout period, with the largest single gain coming from the mobile experience specifically ,mobile conversion rate went from less than half the desktop rate to near parity once load time and form friction were addressed. Contact form completion rate improved by close to 60%, driven almost entirely by the reduction from eleven fields to four.
Bounce rate on the homepage to service page transition dropped by roughly a third, confirming that the messaging alignment fix was closing the expectation gap identified during diagnosis. None of these numbers moved in isolation ,each metric improvement corresponded directly to one of the three root causes identified in the diagnostic phase, which is the clearest evidence that the fix addressed the actual problem rather than a symptom of it.
What We Did Differently
In hindsight, the biggest inefficiency was sequencing the audit itself ,running the full technical speed audit and the behavioral session recordings in parallel from day one, rather than starting with analytics and adding the other tools afterward, would have shortened the diagnostic phase by roughly two weeks. We’d also recommend starting form and trust signal testing earlier in the process, since those changes required no technical development and could have run alongside the speed optimization work instead of after it.
For businesses looking to avoid this same lag, pairing a structured audit with one of our SEO Packages from the outset keeps technical, on page and conversion work moving on parallel tracks instead of in sequence ,which is the single change that would have gotten this client to their result faster.
Conclusion
How to Fix Low Website Conversion Rate almost never comes down to one dramatic problem ,as this research shows, it is usually a handful of specific, fixable friction points hiding behind a vague symptom. Fixing this client conversion rate was not about a full redesign or a guess at what might help, it was about tracing the funnel step by step, isolating the real causes with data instead of assumptions and validating each fix before rolling it out sitewide. That process took a conversion rate that had been quietly stagnant for over a year and more than doubled it in eight weeks, with every gain traceable directly back to a diagnosed cause. If your own site is seeing steady traffic but flat conversions, the lesson here applies directly, the fix is not more traffic and it is not a guess ,it is a structured audit that tells you exactly where visitors are dropping off and why, so the changes you make actually move the number.
Frequently Asked Questions (FAQs)
What is a good conversion rate for a website?
Most industries consider 2–5% a good website conversion rate, with anything above 5% strong and above 10% exceptional. The right benchmark still depends on your specific industry, traffic source and conversion type.
How do you calculate conversion rate?
Divide total conversions by unique visitors, then multiply by 100. For example, 50 conversions from 2,000 visitors equals a 2.5% conversion rate.
Why is my website getting traffic but no conversions?
This pattern usually points to friction, not demand ,slow load times, complicated forms or a mismatch between what your traffic source promised and what the page delivers. It rarely means your audience is not interested.
How long does it take to improve conversion rate?
A properly diagnosed fix typically shows measurable improvement within 4–8 weeks, once changes are validated through A/B testing and rolled out. Complex sitewide issues can take longer to fully resolve.
Is conversion rate a KPI worth tracking closely?
Yes, it is one of the clearest signals of how efficiently your traffic turns into revenue or leads. Tracking it by segment, not just sitewide, makes it far more actionable.